| |
Costs and Expenses
Cost of sales increased 5% in 1997 as compared with 1% in 1996. As a percentage of total revenues, cost of sales declined in both 1997 and 1996 and largely reflects the following factors:
• a more favorable business and product mix
• productivity improvements
• effective foreign exchange hedging programs
 Selling, informational and administrative expenses increased 13% in both 1997 and 1996. These increases reflect a substantial global investment in our pharmaceutical selling efforts. These efforts included the creation of a new U.S. primary-care sales force, as well as the expansion of the U.S. specialist sales forces and sales forces in key international markets. Selling, informational and administrative expenses increased 13% in both 1997 and 1996. These increases reflect a substantial global investment in our pharmaceutical selling efforts. These efforts included the creation of a new U.S. primary-care sales force, as well as the expansion of the U.S. specialist sales forces and sales forces in key international markets.
 These expenses reflect costs of communicating scientific, medical and clinical information about our various products to the medical community and others. Health care information is communicated by field representatives, by means of medical symposia and conventions, as well as through distribution of product literature. These expenses reflect costs of communicating scientific, medical and clinical information about our various products to the medical community and others. Health care information is communicated by field representatives, by means of medical symposia and conventions, as well as through distribution of product literature.
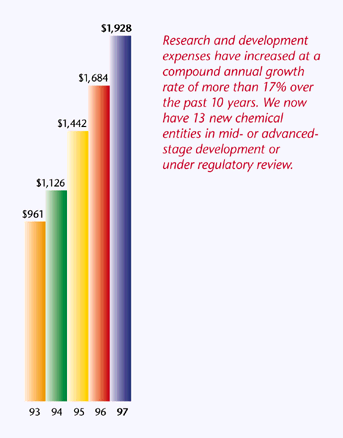
 R&D expenses increased 14% in 1997 and 17% in 1996. These expenditures were necessary to support the advancement of potential drug candidates in all stages of development (from initial discovery through final regulatory approval). Health care R&D expenses, as a percentage of health care revenues, averaged 16% over the last three years. R&D expenses increased 14% in 1997 and 17% in 1996. These expenditures were necessary to support the advancement of potential drug candidates in all stages of development (from initial discovery through final regulatory approval). Health care R&D expenses, as a percentage of health care revenues, averaged 16% over the last three years.
 The effective tax rate decreased from 31.0% in 1996 to 28.0% in 1997. This decrease was due mainly to changes in the mix of income by country and the extension of the R&D tax credit in the U.S. The effective tax rate decreased from 32.1% in 1995 to 31.0% in 1996. This decrease was mainly due to the favorable changes in the mix of income by country, partially offset by the continuing reduction of tax benefits from our operations in Puerto Rico as a result of the enactment of the Omnibus Budget Reconciliation Act of 1993 and the elimination of the tax exemption on Puerto Rican investment income. The effective tax rate decreased from 31.0% in 1996 to 28.0% in 1997. This decrease was due mainly to changes in the mix of income by country and the extension of the R&D tax credit in the U.S. The effective tax rate decreased from 32.1% in 1995 to 31.0% in 1996. This decrease was mainly due to the favorable changes in the mix of income by country, partially offset by the continuing reduction of tax benefits from our operations in Puerto Rico as a result of the enactment of the Omnibus Budget Reconciliation Act of 1993 and the elimination of the tax exemption on Puerto Rican investment income.
 We have received and are protesting assessments from the Belgian tax authorities. For additional details, see note 8, “Taxes on Income.” We have received and are protesting assessments from the Belgian tax authorities. For additional details, see note 8, “Taxes on Income.”Segment Profit
| |
 |
% Change |
 |
| (millions of dollars) |
1997 |
1996 |
1995 |
97/96 |
96/95 |
 |
| Health Care |
$3,309 |
$3,090 |
$2,548 |
7 |
21 |
| Animal Health |
112 |
101 |
97 |
11 |
4 |
| Consumer Health Care |
39 |
36 |
36 |
8 |
— |
 |
 |
| Total |
$3,460 |
$3,227 |
$2,681 |
7 |
20 |
 |
 For additional details, see note 21, “Segment Information and Geographic Data.” For additional details, see note 21, “Segment Information and Geographic Data.”Research and Development Expenses
(millions of dollars)

Income from Continuing Operations
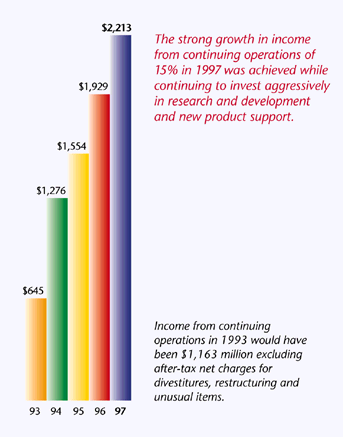
(millions of dollars)

Financial Condition, Liquidity and Capital Resources
The net financial assets/(debt) position as of December 31 is as follows:
| (millions of dollars) |
1997 |
1996 |
1995 |
 |
| Financial assets* |
$3,044 |
$3,154 |
$2,346 |
| Short- and long-term debt |
2,984 |
2,922 |
2,869 |
 |
| Net financial assets/(debt) |
$ 60 |
$ 232 |
$ (523) |
 |
*Consists of cash and cash equivalents, short-term investments and loans and long-term loans and investments.
|
 The net financial debt position at December 31, 1995 resulted primarily from higher debt levels following the SmithKline Beecham animal health acquisition. The net financial debt position at December 31, 1995 resulted primarily from higher debt levels following the SmithKline Beecham animal health acquisition.
Selected Measures of Liquidity and Capital Resources
 |
1997 |
1996 |
1995 |
 |
Cash and cash equivalents and
short-term investments and
loans (millions of dollars) |
$ 1,704 |
$ 1,991 |
$ 1,801 |
| Working capital (millions of dollars) |
1,515 |
828 |
965 |
| Current ratio |
1.29:1 |
1.15:1 |
1.19:1 |
Shareholders’ equity per
common share* |
$ 6.30 |
$ 5.54 |
$ 4.45 |
| Debt to total capitalization** |
27% |
30% |
34% |
 |
*Represents total shareholders’ equity divided by the actual number of
common shares outstanding.
**Represents total short-term borrowings and long-term debt divided by
the sum of total short-term borrowings, long-term debt and total
shareholders’ equity. |
  The increase in working capital from 1996 to 1997 was primarily due to the following: The increase in working capital from 1996 to 1997 was primarily due to the following:
Increases in:
• Accounts receivable—due in part to the alliance revenue receivables
• Inventory—due to higher pharmaceutical inventory levels for new products
• Prepaid expenses, taxes and other assets—due to the reclassification of Valleylab’s net assets to other assets
Decreases in:
• Short-term loans—primarily due to the renewal of short-term loans to loans with maturities beyond one year
• Income taxes payable—primarily due to the settlements of tax-related contingencies
 Working capital decreased in 1996. We utilized working capital provided by operations, as well as the proceeds from the sale of the food science business and stock option transactions primarily for additions to property, plant and equipment, business acquisitions, payments of dividends and the net repayment of long-term debt. Additionally, the 6 1/2% notes due in 1997 were reclassified from Long-term debt to Short-term borrowings in 1996. Working capital decreased in 1996. We utilized working capital provided by operations, as well as the proceeds from the sale of the food science business and stock option transactions primarily for additions to property, plant and equipment, business acquisitions, payments of dividends and the net repayment of long-term debt. Additionally, the 6 1/2% notes due in 1997 were reclassified from Long-term debt to Short-term borrowings in 1996.
 The increase in shareholders’ equity per common share in 1997 and 1996, as well as the decrease in the 1997 and 1996 percentage of debt to total capitalization was primarily due to growth in net income. The increase in shareholders’ equity per common share in 1997 and 1996, as well as the decrease in the 1997 and 1996 percentage of debt to total capitalization was primarily due to growth in net income.
|


